WiFi Tool is published by the developer of the Network Data and HD-POS applications, Helge Magnus Keck, and has the highest rating from all the programs presented so far.
He managed to get an average of 4.7 out of 5 from almost 300 feedbacks. The interface is structured in 4 tabs (WLAN, Analyze, Traffic, and Settings) that can be found on the left side of the dialog box.
The WLAN tab will display a list with all the available SSIDs with the corresponding details. When you are connected to a network, the SSID will be displayed on the top of the dialog box.
In the same area, you will find shortcuts and filters to customize the information displayed and also a disconnect button to end the connection any time you want.
When you click on any SSID from the available networks it will open a new menu on the left side of your dialog box where you will find all the information you need structured in graphics and tables.
All you have to do to connect to one of the available networks is to right-click on the desired network and then you can connect through the application.
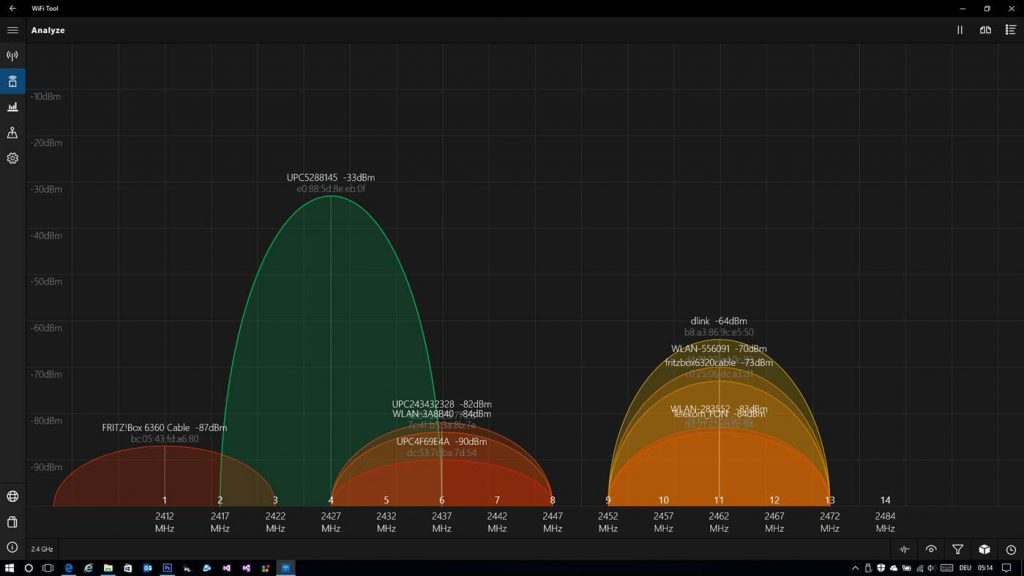
In the Analyze page, you can find different graphics that show the evolution of your connection which can be flipped between 2.4 GHz and 5.0 GHz.
The first graphic is the channel usage but you can also change it to a line graph which will show you the signal power over time.
You have a set of filters at the bottom of the dialog box to adjust and customize the information displayed. More than that, you can choose a 3D presentation for each graphic.
On the upper area of the dialog box, you can find a shortcut to a feature that activates the split view mode where you can view two kinds of graphics at the same time.
Furthermore, in that area you will find a shortcut to a list of networks, so you do not have to switch to the WLAN tab and you can combine this feature with the split view to have 2 graphics and a network list on the same screen.
The Traffic tab is dedicated to the data usage area. This feature is measuring the number of uploads and downloads from every session as a bar graph.
From the main graphic menu, you can select the time period you want to be analyzed. This attribute is available even for networks to which you previously connected.
The Settings tab has a big number of customizable features such as changing the theme, the language, and the region. From this section, you can modify the live tile that will be shown only if you pin the application to the Start Bar.
In the live tile, you can select 2 fields to be displayed. Furthermore, you can customize the WiFi Tool to send a notification every time when you connect or disconnect from a wireless network.
In this article, we presented the best Wi-Fi scanners that will make life easier for you.
They will help you with monitoring your traffic, upload speed, and the strength of your routers signal among other amazing features we already detailed above.
Check them all out, and if you have any additional suggestions or questions, don’t hesitate to leave them in the comments section below.
Editor’s Note: This post was originally published in October 2016 and has been since revamped and updated in August 2020 for freshness, accuracy, and comprehensiveness.
Thank you for viewing the article, if you find it interesting, you can support us by buying at the link:: https://officerambo.com/shop/
No comments:
Post a Comment